(a) Standard design requiring manual adjustment
|
(b) Optimized design
|
Our method uses models of human perception for automatically determining design parameters of a scatterplot for given objectives.
It can be used for one-shot design as well as in cases wherein input data or requirements vary.
The above scatterplots show the pressure and temperature variables from the Hurricane Isabel dataset (number of dots: 5002)
as plotted with (a) a standard design (in this case, the default design in Matlab) and (b) our optimized design.
Click on the images to view the scatterplots in high resolution, and their design in the form of (marker size, marker opacity, image width, aspect ratio).
Similar plots for the same dataset but with different resolutions are available as Supplementary Material of our publication.
Designing a good scatterplot can be difficult for non-experts in visualization, because they need to decide on many parameters, such as marker size and opacity, aspect ratio, color, and rendering order. This paper contributes to research exploring the use of perceptual models and quality metrics to set such parameters automatically for enhanced visual quality of a scatterplot. A key consideration in this paper is the construction of a cost function to capture several relevant aspects of the human visual system, examining a scatterplot design for some data analysis task. We show how the cost function can be used in an optimizer to search for the optimal visual design for a user’s dataset and task objectives (e.g., “reliable linear correlation estimation is more important than class separation”). The approach is extensible to different analysis tasks. To test its performance in a realistic setting, we pre-calibrated it for correlation estimation, class separation, and outlier detection. The optimizer was able to produce designs that achieved a level of speed and success comparable to that of those using human-designed presets (e.g., in R or MATLAB). Case studies demonstrate that the approach can adapt a design to the data, to reveal patterns without user intervention.
|
Click on the above gif to watch the full video, or click here to watch it on youtube.com |
Note: All material is available for use. Please refer to the License section whenever using or adapting this material.
Supplementary material provided with our publication, includes:
Crowdsourcing was used to conduct our empirical user studies for both the calibration and the evaluation phase. Javascript and HTML were used to implement the online experiments and collect the user study data. CrowdFlower was used to recruit participants, forwarding participants to our online experiment.
The code of our scatterplot optimizer is written in Python. All scripts are available for download.
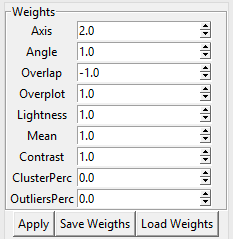
We devised an interactive tool to view the generated scatterplot designs for different weight sets calibrating our cost function. The code of the tool is written in Python. All scripts are available for download.
Other material (11.4MB) available for download, includes:
The official press release:
A selection of other mentions in the media:
PDF (3.9MB),
Supplementary Material (22MB),
DOI link
Towards Perceptual Optimization of the Visual Design of Scatterplots.
IEEE Transactions on Visualization and Computer Graphics, 23(6) : 1588-1599.
@Article{MicallefEtAl2017towards,
    author = {Micallef, Luana and Palmas, Gregorio and Oulasvirta, Antti and Weinkauf, Tino},
    title = {Towards Perceptual Optimization of the Visual Design of Scatterplots},
    journal = {IEEE Transactions on Visualization and Computer Graphics},
    year={2017},
    volume={23},
    number={6},
    pages={1588-1599},
    url={https://doi.org/10.1109/TVCG.2017.2674978},
    doi={10.1109/TVCG.2017.2674978},
    ISSN={1077-2626},
    keywords={Correlation;Cost function;Data analysis;Data visualization;Measurement;Visualization;Scatterplot;crowdsourcing;optimization;perception}
}
|
|
All the files downloaded from the Materials section are under the FreeBSD License. Refer to LICENSE.txt in the downloaded archive file for the terms. | |

|
All other material on this webpage is Creative Commons Attribution-ShareAlike 3.0 Unported License. |
| Luana Micallef | luana.micallef (at) aalto.fi | +358 50 421 0445 |
| Gregorio Palmas | gpalmas (at) kth.se | |
| Antti Oulasvirta | antti.oulasvirta (at) aalto.fi | +358 50 384 1561 |
| Tino Weinkauf | weinkauf (at) kth.se | +46 8 790 6075 |
Luana Micallef was funded by the Academy of Finland, Centre of Excellence in Computational Inference Research (COIN),
and grant agreement 305780.
Gregorio Palmas and Tino Weinkauf received partial funding through the SkAT-VG project,
funded by the EC under FP7-ICT-2013-C, Future Emerging Technologies, grant agreement 618067.
Antti Oulasvirta was funded by the European Research Council (ERC) under the European Union’s Horizon 2020 research
and innovation programme (grant agreement 637991).
Authors would also like to thank: (a) Aalto University School of Science Communications Coordinator Tiina Aulanko-Jokirinne and
translators Janin Koch and Sunjun Kim for contributing to the press release; (b) Janin Koch
for the voice-over to the video; (c) all the participants of the user studies.
Copyright © 2016-2020 Luana Micallef, Gregorio Palmas, Antti Oulasvirta, Tino Weinkauf.
All rights reserved.